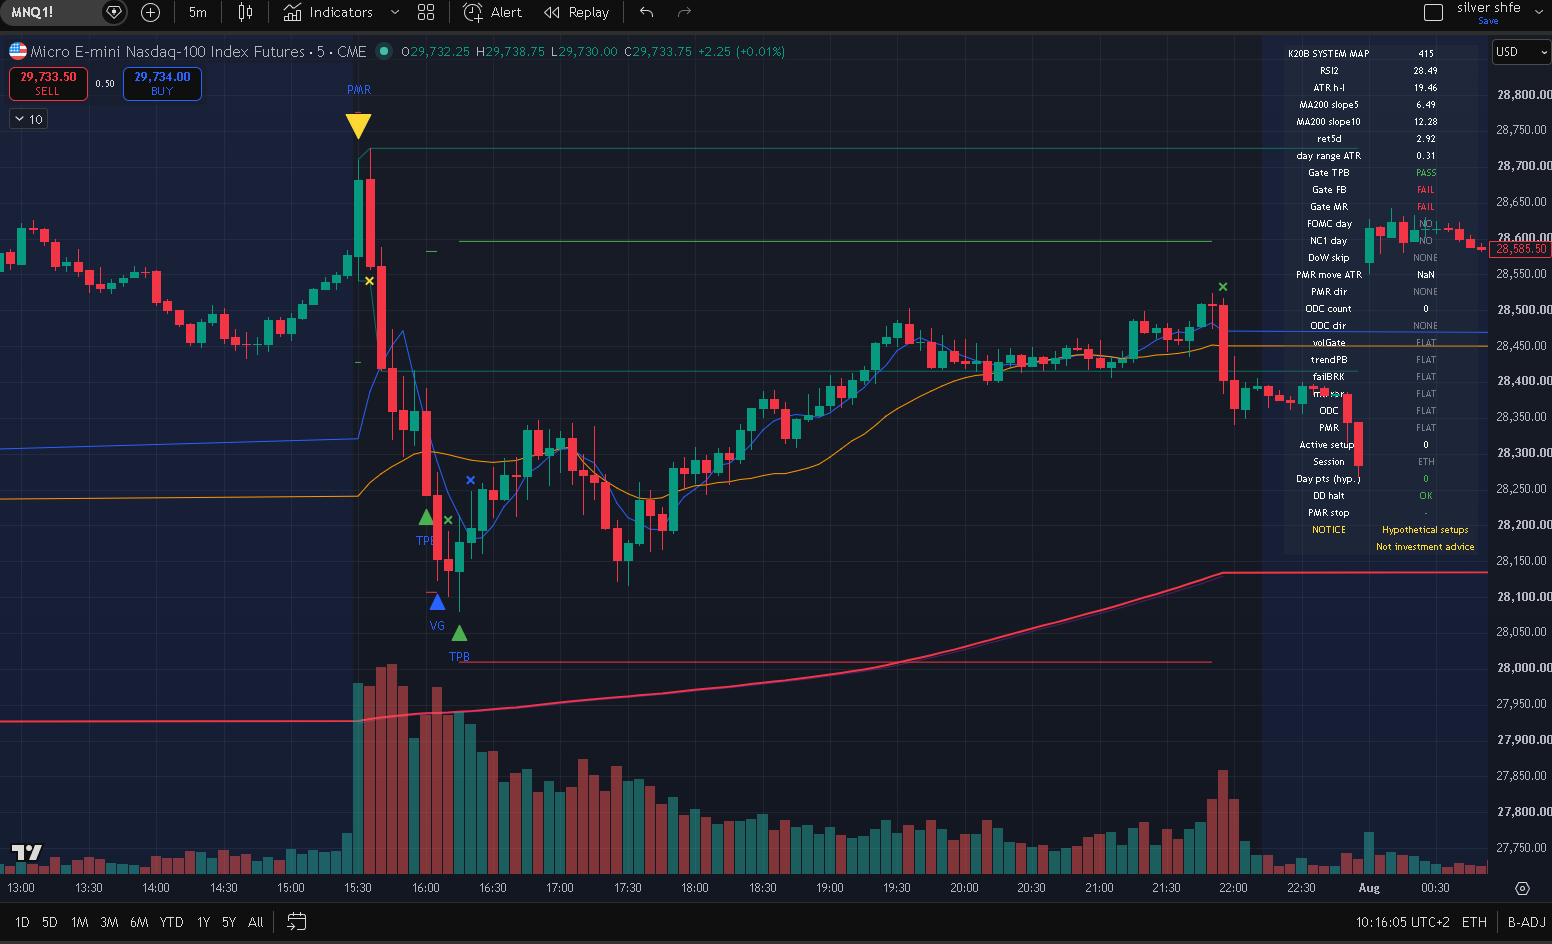
K20B System Map on a live MNQ session - PMR long entry with stop and target levels
Six intraday setups for Micro Nasdaq, built on a live-traded prop-firm system.
Not a backtest experiment. Not a course. A working indicator running on real prop-firm accounts, every session - with the risk management built in.
Cancel anytime. 7-day refund if it's not for you.
Every prop-firm trader knows the same truth: the strategy matters less than the risk rules. One bad day breaches the trailing drawdown. One overnight position violates the rules. One inconsistent day breaks the profit consistency requirement. The K20B System Map was built from the ground up around these constraints - because it runs on real prop-firm accounts that have to survive them.
The system tracks hypothetical daily P&L in real time and stops all new entries when the session loss limit is hit. The indicator shows the halt status live on your chart.
Built into indicatorEvery setup flattens at 15:55 ET. No position is ever held into the overnight session. Zero gap risk while you sleep.
Hard EOD flattenThe system knows FOMC days and skips them. It knows NFP release days. It knows which setups fail on which days of the week. These are built into the logic, not left to your discretion.
FOMC + NFP + DoW filtersAll setups fire within defined RTH windows. No ETH trades, no overnight noise. The trend filter computes on RTH-only bars, matching how futures actually trade - not a generic all-session overlay that lies to you on gap days.
RTH-only indicatorsStops and targets are computed from current volatility, not fixed point values. The system adapts to fast days and slow days automatically. Stop levels are drawn on your chart for every active setup.
Volatility-scaled stopsEach of the six setups has a specific time window when it can fire. No random entries at 14:50. No holding through the close hoping for a miracle. The system trades when the edge exists and sits flat when it doesn't.
6 distinct windowsThis system has been backtested on 661 trading days of MNQ 5-minute data (2018-2026) and is currently live on prop-firm accounts. Below are the real numbers - not cherry-picked, not optimized for a sales page.
BACKTESTED (HYPOTHETICAL)
$71/day
Per account, average across 661 days
6 setups, 1-3 contracts per setup, MNQ futures
LIVE SINCE AUG 2026
Active
Running on real prop-firm accounts
Full audit trail maintained, results tracked daily
| Metric | Value |
| Average daily P&L (per account) | $71 |
| Total P&L over 661 days | $47,027 |
| Winning days | 43% |
| Best day / Worst day | +$3,294 / -$1,486 |
| Monthly average | $1,517 |
| Positive months | 68% (21 of 31) |
| Monthly range | -$2,092 to +$5,211 |
All backtest results are hypothetical. Past performance is not indicative of future results. See full disclaimer below. Live results may differ due to slippage, data feed differences, and execution timing. The system loses on more days than it wins (57% of days are losing or flat) - the edge comes from winners being larger than losers, not from winning often.
The system has been live on prop-firm accounts since August 2026. Real days, real fills, real losses. The system loses on some days - that's what trading looks like. What matters is that the edge compounds over weeks and months, not that every day is green.
Live results are tracked daily and will be published as a verified track record once sufficient history exists. The system is designed to survive prop-firm evaluation rules - not to win every day.
K20B System Map on a live MNQ session - PMR long entry with stop and target levels
Every session, the System Map watches for six distinct intraday conditions on MNQ. When one aligns, it marks the entry, draws the stop and target levels, and fires an alert. You see exactly what the system sees - in real time, on your own chart.
Fires at the 9:30 ET session open
Detects when the premarket move has overextended against the session's likely direction. Counter-move entry at the bell.
Mid-session (10:00 - 14:00 ET)
Catches pullbacks in an established uptrend. Only fires when the trend filter confirms and momentum hasn't exhausted. The bread-and-butter setup.
Open drive window (9:30 - 10:30 ET)
Catches panic dips that bounce. Only fires at extreme readings where the probability of a snap-back is highest.
Morning session (9:30 - 11:00 ET)
Detects when a breakdown is failing under a deteriorating trend. The move that looks like continuation but is actually exhaustion.
Lunch session (12:00 - 14:00 ET)
Counter-trend bounces in a downtrend that have run too far, too fast. Tight ATR-bounded entries only.
Post-open (9:45 - 11:00 ET)
When the opening bars show a strong directional drive, this setup catches the continuation breakout. Skips days with no drive.
Not a theoretical backtest packaged for sale. The system behind this indicator trades real prop-firm accounts every day.
Daily loss halts, session-only windows, calendar filters, EOD flatten. The risk rules are in the system, not in a PDF you'll never read.
Entry markers, stop levels, target levels, regime gates, DD halt status, and active position tracking - all on the chart, all in real time.
| Instrument | MNQ (Micro Nasdaq-100 futures) |
| Timeframe | 5 minutes |
| Extended hours | Required (one setup reads premarket data) |
| Platform | TradingView Premium (for invite-only access) |
| Designed for | Prop-firm evaluations and funded accounts |
| Setup time | Under 2 minutes - add to chart, enable alerts |
€99/month
Full indicator. All six setups. All risk management features. Cancel anytime.
After subscribing, send your TradingView username to [email protected] to receive your invite within 24 hours.
All setups displayed by this indicator are hypothetical and for educational and informational purposes only. This indicator is not investment advice, not a solicitation to buy or sell any security or derivative, and not a recommendation to engage in any trading strategy. References to prop-firm accounts are for informational purposes only and do not imply that any user will achieve similar results.
HYPOTHETICAL PERFORMANCE RESULTS HAVE MANY INHERENT LIMITATIONS, SOME OF WHICH ARE DESCRIBED BELOW. NO REPRESENTATION IS BEING MADE THAT ANY ACCOUNT WILL OR IS LIKELY TO ACHIEVE PROFITS OR LOSSES SIMILAR TO THOSE SHOWN. IN FACT, THERE ARE FREQUENTLY SHARP DIFFERENCES BETWEEN HYPOTHETICAL PERFORMANCE RESULTS AND THE ACTUAL RESULTS SUBSEQUENTLY ACHIEVED BY ANY PARTICULAR TRADING PROGRAM.
ONE OF THE LIMITATIONS OF HYPOTHETICAL PERFORMANCE RESULTS IS THAT THEY ARE GENERALLY PREPARED WITH THE BENEFIT OF HINDSIGHT. IN ADDITION, HYPOTHETICAL TRADING DOES NOT INVOLVE FINANCIAL RISK, AND NO HYPOTHETICAL TRADING RECORD CAN COMPLETELY ACCOUNT FOR THE IMPACT OF FINANCIAL RISK OF ACTUAL TRADING. FOR EXAMPLE, THE ABILITY TO WITHSTAND LOSSES OR TO ADHERE TO A PARTICULAR TRADING PROGRAM IN SPITE OF TRADING LOSSES ARE MATERIAL POINTS WHICH CAN ALSO ADVERSELY AFFECT ACTUAL TRADING RESULTS. THERE ARE NUMEROUS OTHER FACTORS RELATED TO THE MARKETS IN GENERAL OR TO THE IMPLEMENTATION OF ANY SPECIFIC TRADING PROGRAM WHICH CANNOT BE FULLY ACCOUNTED FOR IN THE PREPARATION OF HYPOTHETICAL PERFORMANCE RESULTS AND ALL WHICH CAN ADVERSELY AFFECT TRADING RESULTS.
Futures trading involves substantial risk of loss and is not suitable for all investors. Carefully consider whether such trading is suitable for you in light of your financial condition. Past performance is not indicative of future results.